The Data Product Canvas wants to help you build high-performance data products. Can it live up to its promise? How does it map to ADML?
Introduction
Canvases1 have become something of a trend. Canvases are one-page documents where you can collect all the necessary information for a project, for an idea, for a product or for whatever.
The latest of these canvases that I’ve been made aware of is the Data Product Canvas. It promotes itself as “how to avoid the right solution to the wrong problem”—which is important for those of us developing data products, I believe.
 |
|---|
| The Data Product Canvas is a one-page place to capture associated information for data product development. |
On the surface2, this new canvas seems pretty good. Its heart is in the right place. It’s a neat way of summarising the information required to build a compelling data product (or at least some of a data product), plus a modicum of guidance towards how you might do that.
In this post I’ll review the Data Product Canvas. I’ll explore how to get the most out of it. And, of course, I’ll reference ADML which is the attempt to achieve similar goals authored by Nadav Rayman and me.
The Analytics Heliosphere
| ADML’s Analytics Heliosphere guides users in developing compelling data products. |
The issues with data products
Developing data products is hard. In general, we are not good at it. Here’s why developing data products is difficult.
They go wrong
Data products can go wrong in a number of ways. My experience in working with clients and leading data teams is that they go wrong more often than they don’t. The upshot? We are generally bad at developing data products.
But when they go right there is a huge payoff: revenue, savings or reduced workload. Ultimately, better decisions are made using them—saving time, saving money and reducing errors.
When they go wrong, it is a different story. Money is sunk in development—using expensive data and project resources. There’s the opportunity cost: data and project resources that could (should?) have been building something that delivered actual, measurable benefits. And the problem that they were trying to address remains unsolved, and so continues to bleed time and money.
They are hard to develop
When we are building a data product, we are doing something that has not been done before: solving a problem that we haven’t solved before. Compared with, say, software engineering, development practices for data products are much less mature; hence they have fewer established best practices for managing their development. Practices, frameworks and tools to support the development of data products are in their infancy. This lack of maturity is, in part, the inspiration for ADML.
They involve different teams who use different languages
A data product will typically require at least three teams to cooperate in the product’s development: a business team, a technology team and a data team. These teams typically have different imperatives, they have different ways of doing things and they speak different languages.
Deliberate effort needs to be put in to ensure the teams have a common understanding of the terms being used. (More on this later.)
They have multiple components
Data products bring together code development with data, with a result that needs to be shoehorned into a business process. They are data hungry apps that need to be used by people. A well-designed interface that contains the wrong data is useless. A tool displaying correct data that is delivered poorly won’t be used.
Because they have these disparate components, data products need testing at different stages of their development to ensure they are useful and usable. In practice, this testing is often rudimentary or not done at all.
There’s no such thing as a data product
I’m being glib here; of course there are data products. But we can gain perspective by stepping back and stop drinking in the flood of messaging that we see about the importance of data.
Data is not important. Not by itself. Not out of context.
Data is only important in the context of an issue or imperative that it can inform. Therefore data products need to be explicitly designed to inform decisions about these issues and imperatives.
Data Product Canvas
I acknowledge that the Data Product Canvas is trying to help us do something we find difficult. Now I’ll dig a bit deeper into the canvas itself and its components.
Components of Data Product Canvas
The flowchart below shows the sequence of stages represented by Data Product Canvas.
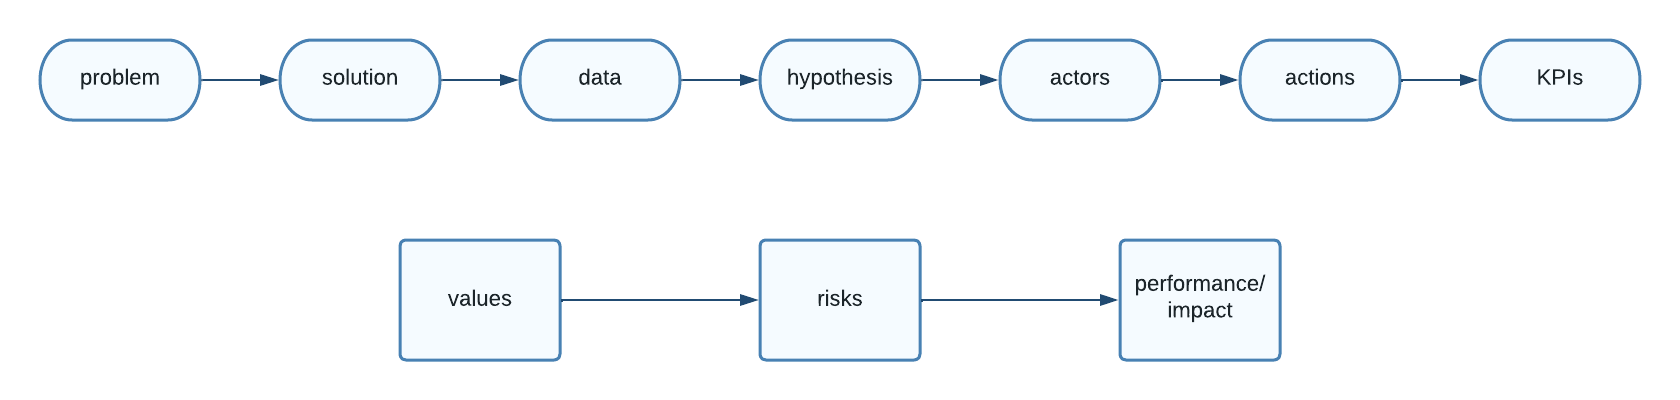
The sequence of stages in Data Product Canvas.
Personally I recommend a different ordering which can be represented cyclically.
Let’s look at each of these stages.
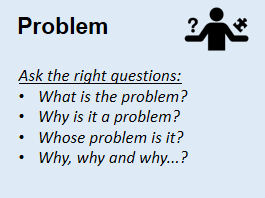
Problem
This part of the Data Product Canvas acknowledges that you cannot just throw money at the problem. It is all too common that the finished data product constitutes a great solution to the wrong problem. I have seen myself how a data product owner, given a good solution, will try to adapt the problem to the solution at hand. This almost never works.
 |
|---|
| How to define the problem from Data Product Canvas |
Solving the problem is more than asking the right questions, though. We need to
- Identify the business imperative, e.g. maximise revenue from customers
- Identify current issues that are restricting the imperative’s full potential, e.g. customer churn is too high
- Identify the desired change to the status quo, e.g. reduce customer churn by 20%
- Develop hypotheses on how this might be achieved, e.g. offer additional benefits to customers who are at a high risk of churning
In ADML, these are covered in the information design and hypothesis design rituals.
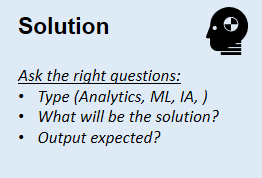
Solution
“A data product is not a technical problem, but a business problem.”
The Data Product Canvas is completely correct in this (remembering that there’s no such thing as a data product).
 |
|---|
| How to identify the solution from Data Product Canvas. |
I would argue, however, at this stage it is just too early in the lifecycle of the data product to design a solution. We need to go through the hypothesis design and data readiness rituals in ADML to identify the appropriate solution, given the needs and resources we have.
You also need additional metadata to capture information about the data product. Here’s an excerpt from the ADML whitepaper detailing relevant product metadata.
| DATA PRODUCT METADATA | EXAMPLE METADATA VALUES |
|---|---|
| Product category | Dashboard Report Alert Recommendation What-if tool Predictive model Optimisation |
| Publishing mechanism | API Application embedded Visualisation portal Desktop tool Dataset |
| Approved purpose | Compliance Operational Strategic planning Exploratory |
| Reliability rating | Gold Silver Bronze |
| Sensitivity rating | Public General Confidential Highly confidential |
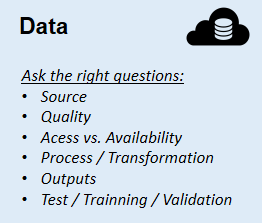
Data
The Data Product Canvas emphasises data challenges; that quality of data is key; that the result depends on the quality of the data. This is all true.
 |
|---|
| How to map all that you need from the data from Data Product Canvas. |
ADML digs into the data further. The data readiness ritual validates whether data even exists in a form that will support your analytics objectives. It covers data sourcing and data quality across a number of attributes, along with a rating of suitability to achieve the objectives, shown below.
| DATA READINESS CATEGORY | DESCRIPTION | EXAMPLE MEASUREMENTS |
|---|---|---|
| Availability | How easy is it to acquire data in a timely and repeatable manner? | Data extraction window |
| Clarity | Is the meaning of the data well understood? | Data definition supplied % Business rule adherence |
| Coverage | To what extent is data being captured as part of a business process? | % Null / Blank |
| Consistency | Is there too much variation in how data is being captured? | Value Distribution % Abnormalities |
| Authority | Has the best source of data been made available? | Anecdotal Stakeholder Feedback Attribute duplication across data sets |
| Cross-relatable | Can data be related to other entities and processes reliably? | % Orphaned rows in data set comparisons |
Hypothesis
Near and dear to my heart3 is the hypothesis. Data products should be built with a hypothesis in mind.
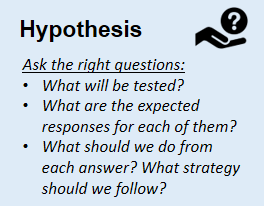 |
|---|
| What hypothesis will be tested? from Data Product Canvas |
The hypothesis design ritual in ADML extends this thinking. It gives you additional tools to map and explore hypotheses. It ties business imperatives to the expected outcomes needed to achieve them, and map drivers of those outcomes and the different decisions and interventions that might influence the drivers to change the outcome. We map these in a visual format. This ensures that we can see multiple relationships allow for changes in complex systems. The output of this is the hypothesis map.
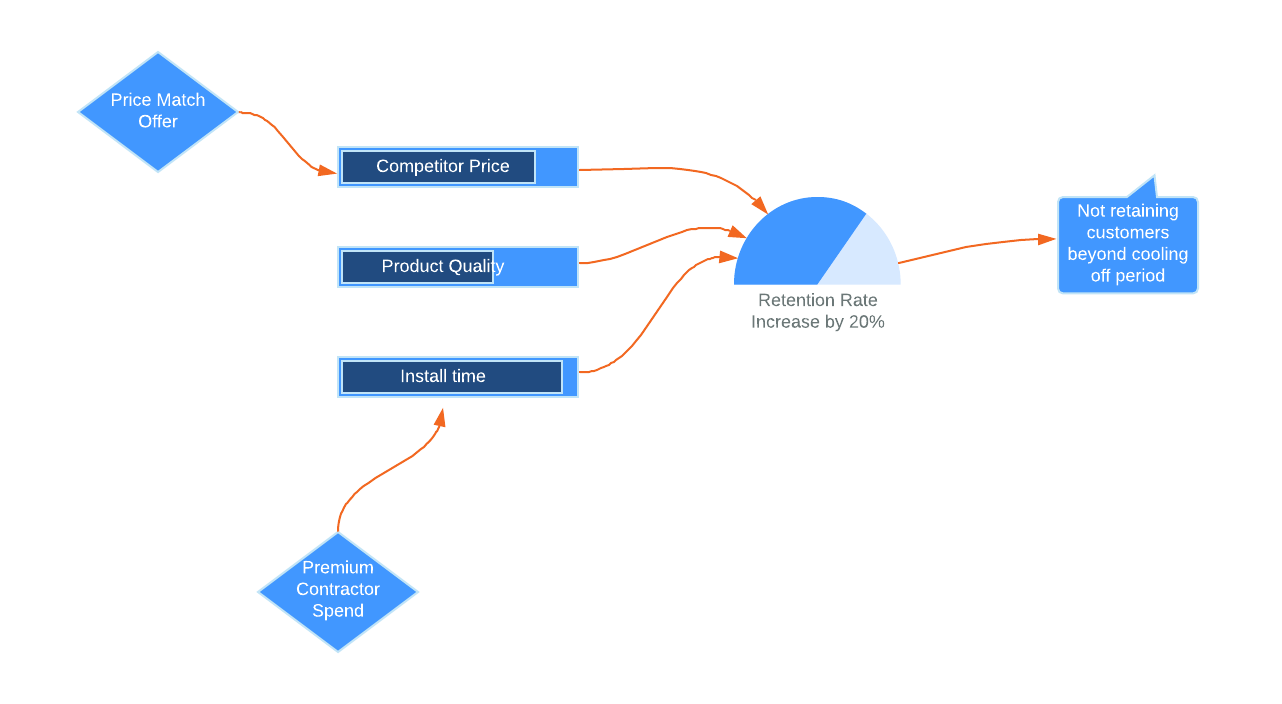 |
|---|
| An example hypothesis map. |
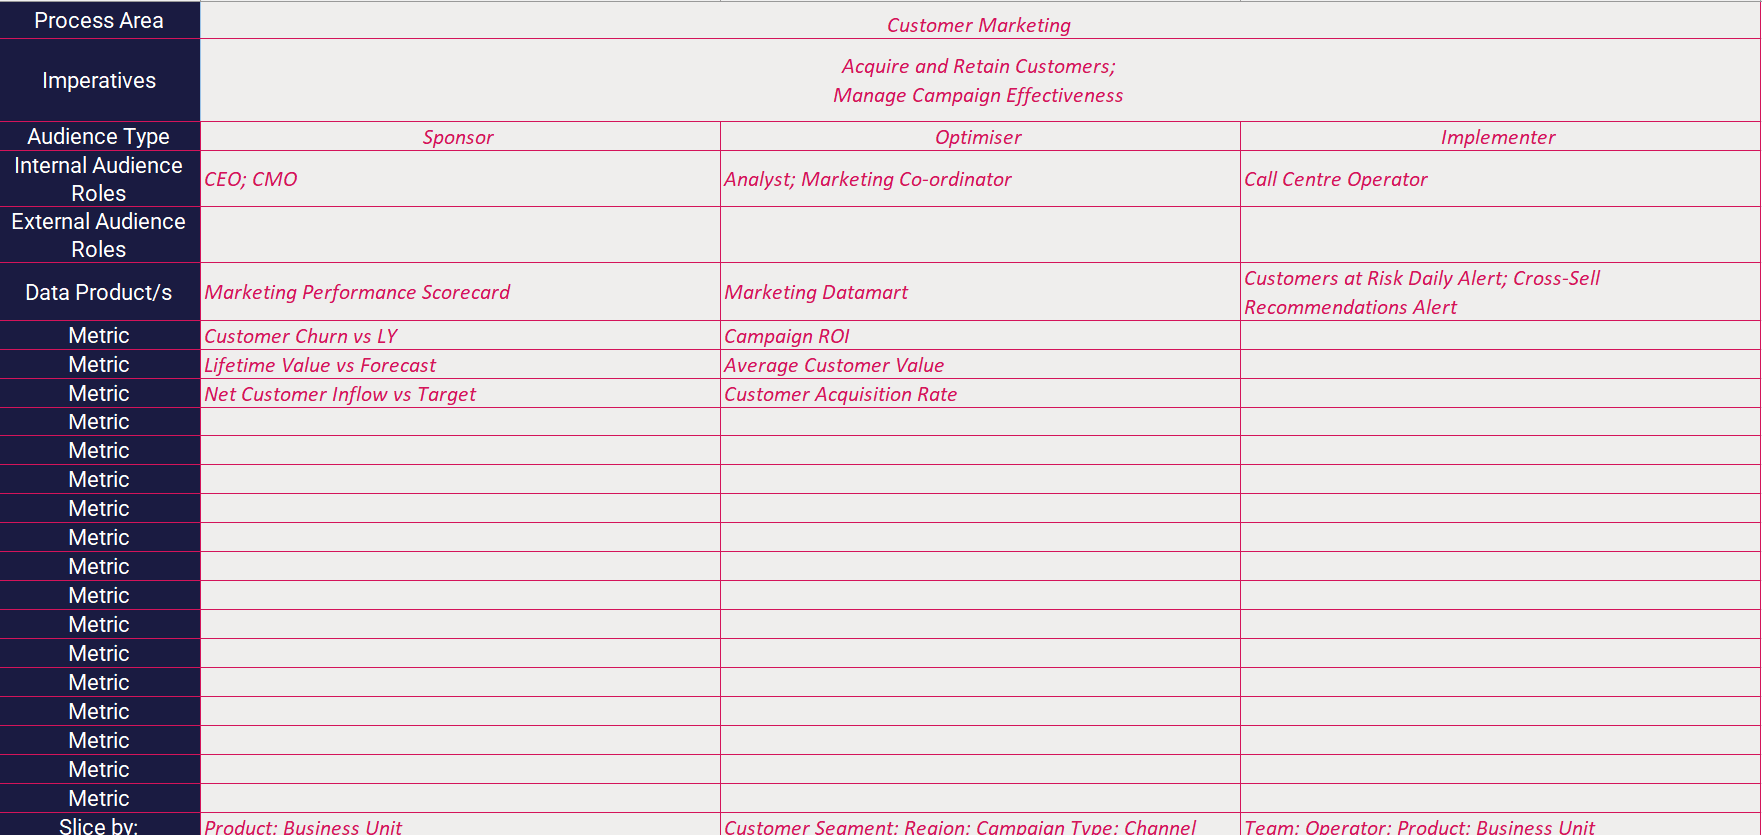
Actors
The second domain area of the Data Product Canvas deals with strategy and is shaded in green. It considerd the actors: the individuals and roles that have an interest in the data product.
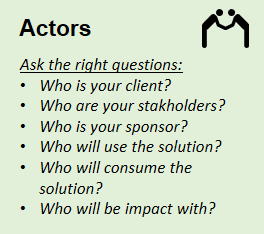 |
|---|
| How to identify the actors? from Data Product Canvas |
This maps neatly to ADML’s User Information Design as part of the Information Design ritual, which breaks down the data product needs for each of three archetypes. ADML goes into more detail.
| USER ARCHETYPE | DESCRIPTION | EXAMPLE ROLE | INFORMATION NEEDS | HISTORICAL SYSTEMS USED |
|---|---|---|---|---|
| Sponsor | A stakeholder who is ultimately accountable for an outcome | Chief Executive Officer | Evaluative information e.g., KPIs / scorecards | Corporate performance management / executive information systems |
| Optimiser | An agent who is responsible for identifying improvements to achieve a particular outcome. | Manager Analyst | Suggestive information Driver metrics / dashboards | Business intelligence visualisation tools Statistical packages |
| Implementer | An agent who is responsible for taking action in the business process. Typically acts on instructions or recommendations and is not tasked with reflection nor analysis. | Sales Representative Field Technician | Instructive information Alerts / reports | Operational reporting |
Actions
At this stage of the data product’s development, Data Product Canvas suggests that the Data Product Manager and stakeholders define the strategic actions that will be taken from using the product.
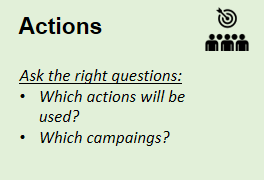 |
|---|
| How to plan the actions? from Data Product Canvas |
I will argue till I am blue in the face that this is much too late to define the actions. The actions that will influence behaviour are a key part of the hypothesis design and the design of the solution; they are a key part of the data product. Just think, if we want to make real-time recommendations to call centre staff, the solution will look a lot different than if we want to inform call centre leaders of trending call topics every hour.
ADML ties the actions into the hypothesis design in the form of drivers and interventions. At the more detailed level, we must be able to measure the effect of our actions as part of the learning ritual.
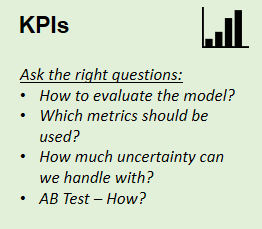
KPIs
This section of the Data Product Canvas is really important. When developing data products, we must include the measurement of the success of the product as well as its components. All too often the measurement has been left till last or never done at all! Indeed, without measurement your data product may be doomed to fail.
 |
|---|
| How to create the KPIs to monitor the product along the journey? from Data Product Canvas |
In ADML, the definition of metrics and KPIs flows directly from the User Information Design. They are placed in the context of the business activities and processes that are being measured. The Hypothesis Design will also specify how to quantify a meaningful result that aligns with business imperatives.
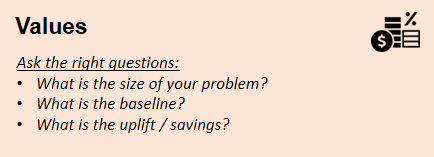
Values
One of the important components of a data product is, of course, whether it is worth making. But beyond a business case, it is astonishing how often the due diligence required just doesn’t get done. Data Product Canvas suggests recording value measures associated with the product.
 |
|---|
| How to estimate values from Data Product Canvas |
In addition to these which are covered in the Information Design, ADML advocates capturing the specific benefits of a product in the Learning ritual systematically and periodically. The table below shows an example.
| DATA PRODUCT BENEFIT ATTRIBUTES | EXAMPLE |
|---|---|
| Benefit name | Incremental profit |
| Benefit amount | $230,000 |
| Period | 2021-06-01 to 2021-12-31 |
Over time this will give a time series view of the benefits accrued by your data product.
Risks
Although it is not the purpose of the canvas to manage risks, mapping them can be beneficial to managing your data product.
 |
|---|
| How to map the risks from Data Product Canvas |
As ADML is neither a project management nor risk management methodology, risks are not covered explicitly.
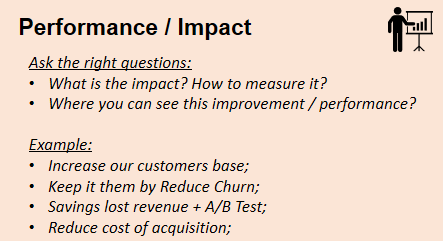
Performance/impact
Much as I hate slashes in writing, measurement of the impact and benefits of the data product is key to success. Being able to quantify the value of a data product helps to secure ongoing investment in its maintenance and decisions on when it should be retired.
 |
|---|
| How to identify performance and impacts from Data Product Canvas |
ADML captures the responses to these questions—and more—in the Learning ritual. An integral part of a data product is its ongoing performance. In ADML, we suggest that periodic learning takes place and is captured. The items we want to capture are shown in the table below.
| LEARNING CATEGORY | LEARNING CATEGORY DESCRIPTION | ADDITIONAL QUESTIONS TO PROMPT RESPONSES |
|---|---|---|
| Precedent | Have we done this before? | What was the context? What did we do? |
| History | What happened last time? | What interventions were taken? What were the outcomes? Did the results validate the assumptions? |
| Differences to precedent | How is this different to previous times? | How were our assumptions different to historical assumptions? Can we translate these differences into quantitative associations? |
| Conclusion | What should we do differently? | How are our future interventions informed by the combination of what we have done before, what happened and how this time is different from other times? |
But wait there’s more

There are (at least) a couple of other good reasons to use ADML.
First, ADML ensures that a common language for developing your data product is captured and agreed. This avoids later disagreements over the definition of measures like customer churn rate and even definition that everyone thinks are obvious, like who is actually a customer4.
Second, by using ADML you ask a lot of questions that generate answers, and these answers need to be captured far beyond what a one-page summary could represent. The ADML Design Workbook is an Excel spreadsheet made for capturing all the information you need to build a great data product. Please download it and see for yourself.
 |
|---|
| The User Information Design tab of the ADML Design Workbook. |
Conclusion
I am always going to support tools and techniques that encourage us to successfully develop data products. And creating a one-page synopsis is a great idea. Kudos to Data Product Canvas!
If you like the idea of the Data Product Canvas or are involved in developing data products, I invite you to check out ADML. It is a comprehensive methodology for developing successful data products that has come from decades of experience in data, analytics, machine learning and building data products.
-
My two minutes of research into these canvases has their ancestor sitting with Alexander Osterwalder’s Business Model Canvas. We now have an infestation of canvases like Machine Learning Canvas, Data Science Canvas and Project Canvas. ↩
-
While ignoring the lack of proofreading in the canvas. ↩
-
Please don’t confuse this with statistical hypothesis testing. ↩
-
And hoping this question does not kick off an expensive master data management exercise when everyone inevitably gives a conflicting answer. ↩